
- Features
- Searchable Fields
- Libraries
- Facet Features
- Types of Facets
- Configure Facets
- Field Mapping
- Field Properties
- Configure Site
- Profile
- Team Management
- Sites
- Global Coverage
- Disaster Recovery
- Features
- Template Selection
- Keyword Suggestions
- In-Field Suggestions
- Top Search Queries
- Popular Products
- Trending Queries
- Promoted/Blacklisted Suggestions
- Real-time Preview
- Instantaneous Publishing
- Ranking Insights
- Clickstream Data
- Boost/Bury
- Sort
- Slot
- Pin
- Filter
- Landing Pages
- Redirects
- Set Banners
- Ranking Insights
- Create a Site Rule
- Managing Field Rules
- Managing Query Rules
- Campaign
- A top-down approach
- Faster and simpler
- Relevant Metrics for better analysis
- Interactive and easy-to-view preview
- Feature-filled Listing Page
- Promotions
- Banners
- Facets
- Redirects
- Add New Promotions
- Boost/Bury
- Sort
- Slot
- Pin
- Filter
- Landing Pages
- All Queries
- Query-based Banner
- Field-based Banner
- Creating Field-based Facets
- Create a Site Rule
- Overall Performance
- Query Report
- Zero Result Queries
- Product Reports
- In-field Suggestions
- Keyword Suggestions
- Top Search Queries
- Popular Products
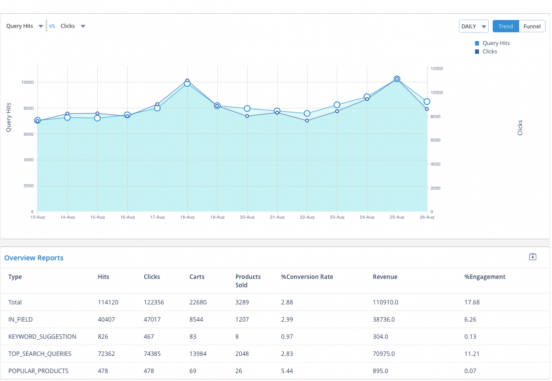
This report, labelled as Typeahead report, shows the engagement metrics of Autosuggest parameters like In-fields, keyword-suggestion, top queries, and popular products. The ’Overview’ tab shows you the consolidated data for all the suggestion types in the same screen. When a shopper types a query and selects a query suggestion, Unbxd analytics tracks the products ordered via in-feature suggestions, keyword suggestions, or from the list of popular products. Therefore, we get an overview report including all the individual metrics, conversion rate, revenue %, and % of engagement.
When auto-suggest provides query results, for some of the products, it displays an In-field suggestion. In-field suggestions are sub-fields of an auto-suggested query. In-field suggestions are displayed when the products are defined under different categories. They typically represent the query in the context of the category or brand.
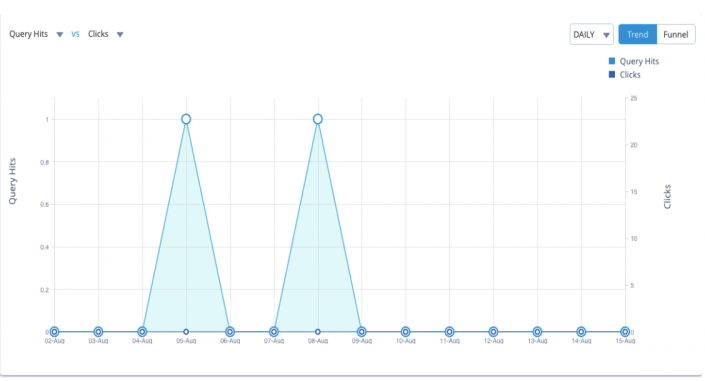
As we can see in the above illustration, we can see that the maximum number of hits and clicks were received on 5th of August and 8th of August. The graph shows the metrics of the number of query hits, depicted on the left side x-axis v/s the number of clicks, on the right x-axis. The report shown here is from 02-Aug to 15-Aug.
Keyword suggestion is the basic query suggestion you get when you start typing a product name (query). Suggestions appear based on the search term you type or its relevant synonyms. With the keyword suggestion report, you can view all the queries that get hits, clicks, or orders for the selected period of time.
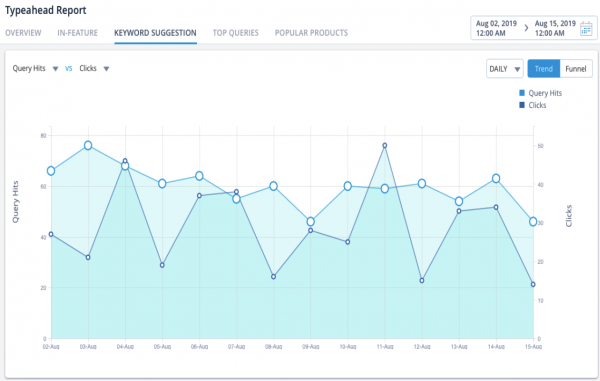
As we can see in the above illustration, the maximum number of hits and clicks were received on the 3rd of August and 11th of August. Such insights show the decline and The graph shows the metrics of the number of query hits, depicted on the left x-axis v/s the number of clicks, on the right x-axis. The report shown here is from Aug 02,2019 to Aug 15, 2019.
Top Queries appear based on shoppers’ behavior on the site. The frequently searched queries and the related synonyms are added as suggestions.
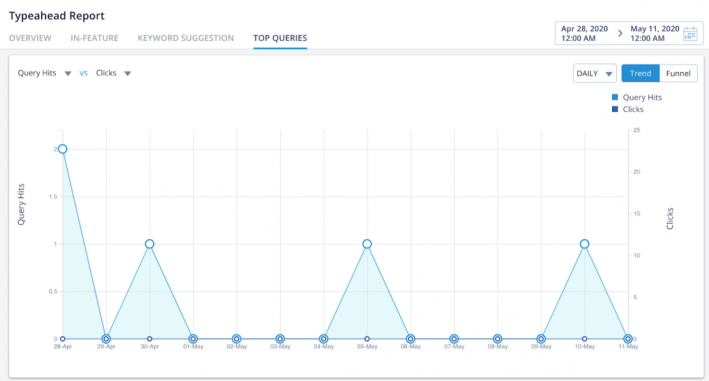
As we can see in the above illustration, the maximum number of hits and clicks were received on the 3rd of August and 11th of August. The graph shows the metrics of the number of query hits, depicted on the left x-axis v/s the number of clicks, on the right x-axis. The report shown here is from Aug 02,2019 to Aug 15, 2019.
The list of similar products appears based on the query phrase that you type. In this way, the buyer gets more options to add to the cart by just a single click.
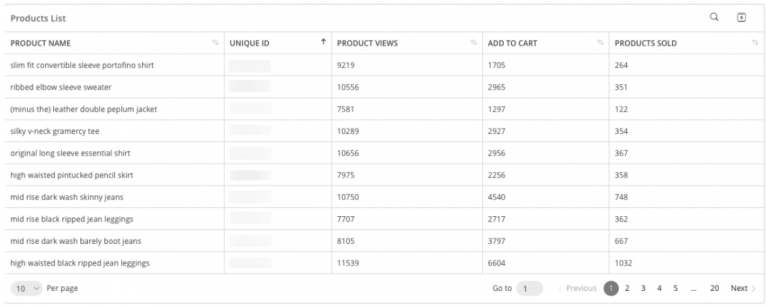
So, as you can see, product like ‘slim fit convertible sleeve portofino shirt’ was viewed 9219 number of times, added to the cart 1705 times, and ordered 264 times. In this way, you get to know the popular products or the least popular ones. We can
You can change the order of the products based on any of the metrics.
- Did this answer your question?

